A three sizes visualizer can reduce the uncertainty that drives online apparel returns, with up to 40% of clothing returns linked to sizing problems. Its value comes from comparing garment-specific fit across adjacent sizes, not from displaying three attractive images.
The hesitation is familiar. A shopper reaches checkout, switches between Medium and Large, studies a model photo, and tries to predict whether the sweater will skim the body or hang loosely at the waist. The size chart gives measurements, but it doesn't show drape, clearance, sleeve position, or silhouette. The shopper either delays the purchase or orders multiple sizes and plans to return one.
That moment exposes the weakness of many online fitting features. A single model image can look precise while saying little about how the same garment changes between sizes. A credible visualizer should behave more like a fitting-room decision aid, showing what changes when the shopper moves from one candidate size to the next.
Table of Contents
- Why Shoppers Stall at the Three Sizes Choice
- What a Three Sizes Visualizer Actually Models
- Static Charts, Single Models, and Multi-Size Previews
- Designing a Trusted Three-Size Comparison View
- Business Impact of Better Size Visualization
- Limits, Privacy, and Honest Positioning
- How to Implement a Three Sizes Visualizer on Your Store
Why Shoppers Stall at the Three Sizes Choice
At a physical store, a shopper can pull on a medium, reach forward, check the shoulders, and compare it with a large. Online, those signals disappear. The customer has a label, a product photograph, and perhaps a chart that maps the label to assumed body measurements. The history of apparel sizing helps explain why this remains difficult: standardized labels emerged with mass-produced ready-to-wear clothing, while earlier garments were made to individual measurements. Military uniform production during the 1800s helped establish repeatable sizing systems, but those systems were never a complete description of personal fit. The history of sizing and the move toward individualized fit information provides useful context.
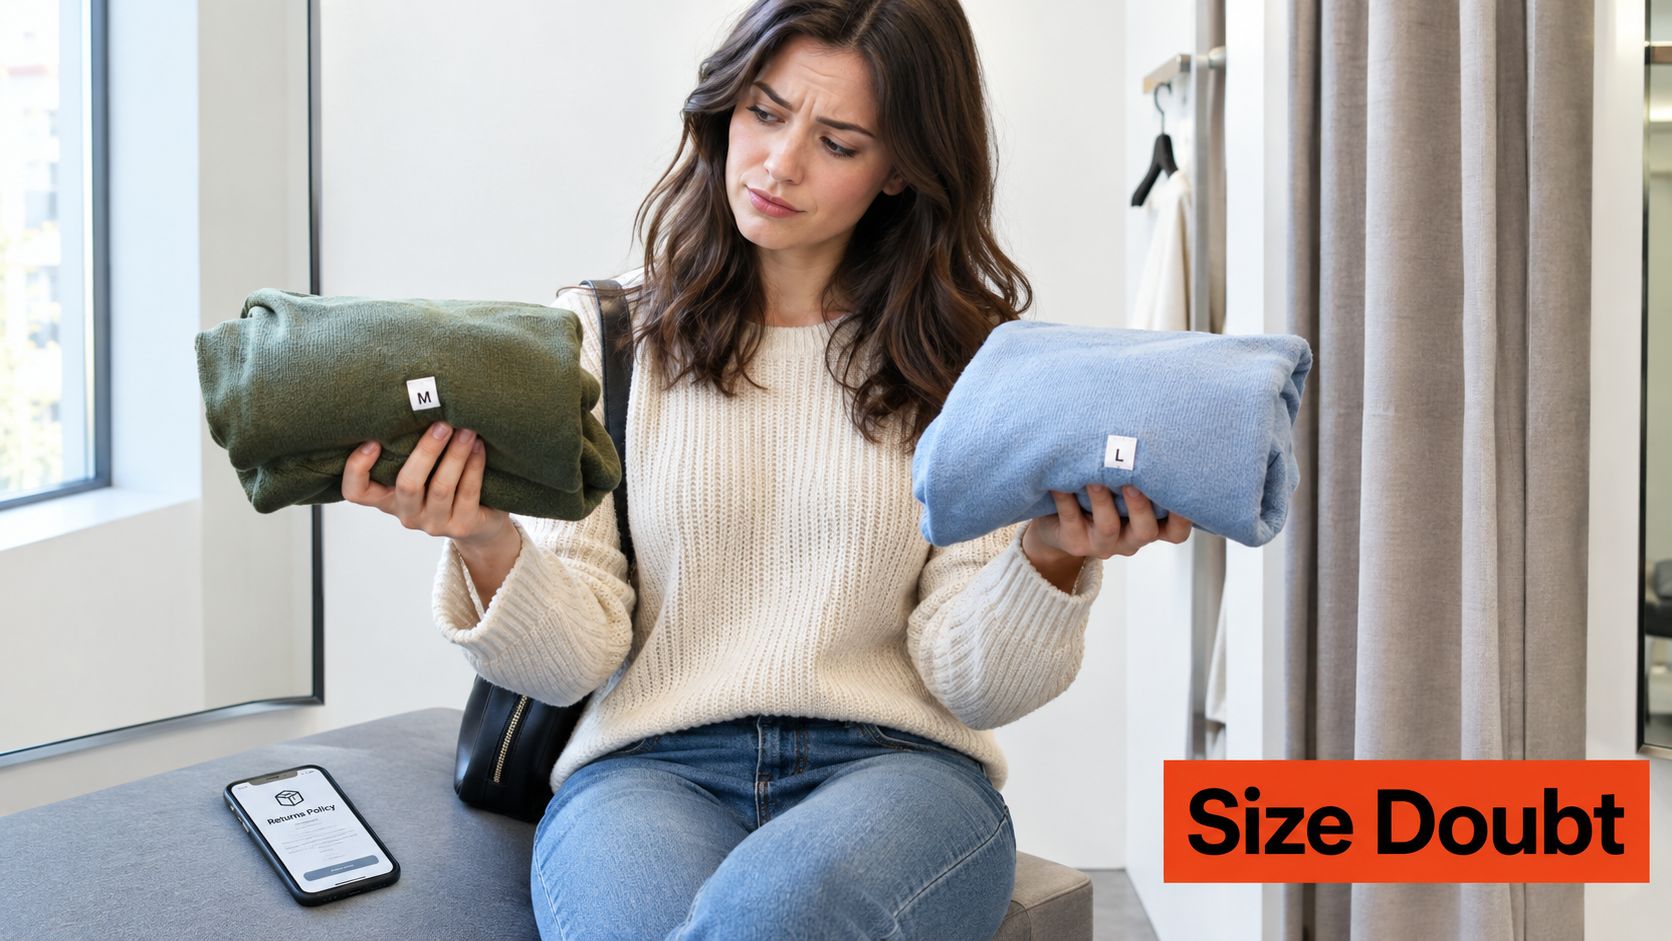
A shopper choosing between three adjacent sizes isn't asking only, “Which label matches me?” They're asking whether the shoulder seam will sit correctly, whether the body will pull across the chest, and whether a larger size will create excessive length. Those are comparative questions. One rendered view can't answer them well because it hides the fit range.
The checkout decision is comparative
A three-panel view becomes useful when every panel holds the important variables constant. The shopper should see the same body model, pose, camera angle, lighting, and product, with the size changing as the controlled input. The difference between panels then communicates a practical signal: more room through the torso, a lower hem, a different sleeve position, or a shift in shoulder alignment.
This isn't visual decoration. It helps the customer decide whether the recommended size is comfortably within the garment's intended range or close to a boundary. It also gives the shopper a reason to choose one size rather than adding several sizes to the cart as insurance.
Practical rule: Show three sizes to explain the decision, not to create the impression that every size is equally suitable.
The commercial context is serious. Industry estimates cited in the Future of Fit report place apparel e-commerce return rates at about 25%, compared with roughly 20% for e-commerce overall, and estimate that online apparel purchases can experience return rates nearly twice those of in-store purchases. Retailers also need to manage the abandonment that occurs before the order exists. For broader checkout recovery tactics, the YipSMS guide to cart recovery is a useful complementary resource.
A multi-size view won't solve inaccurate product data or poor garment rendering. It can, however, make the fit decision more legible. That distinction matters. The problem of online shopping is not only that shoppers can't see themselves in clothes. It's that they can't reliably translate their body inputs and a product's construction into a likely outcome. The sections that follow focus on that translation.
What a Three Sizes Visualizer Actually Models
A reliable three sizes visualizer treats sizing as an interval problem, not a universal label lookup. A shopper's body measurement is an input. Each garment size represents a range of body dimensions and a corresponding finished-garment shape. The interface has to compare those ranges against the product being viewed.
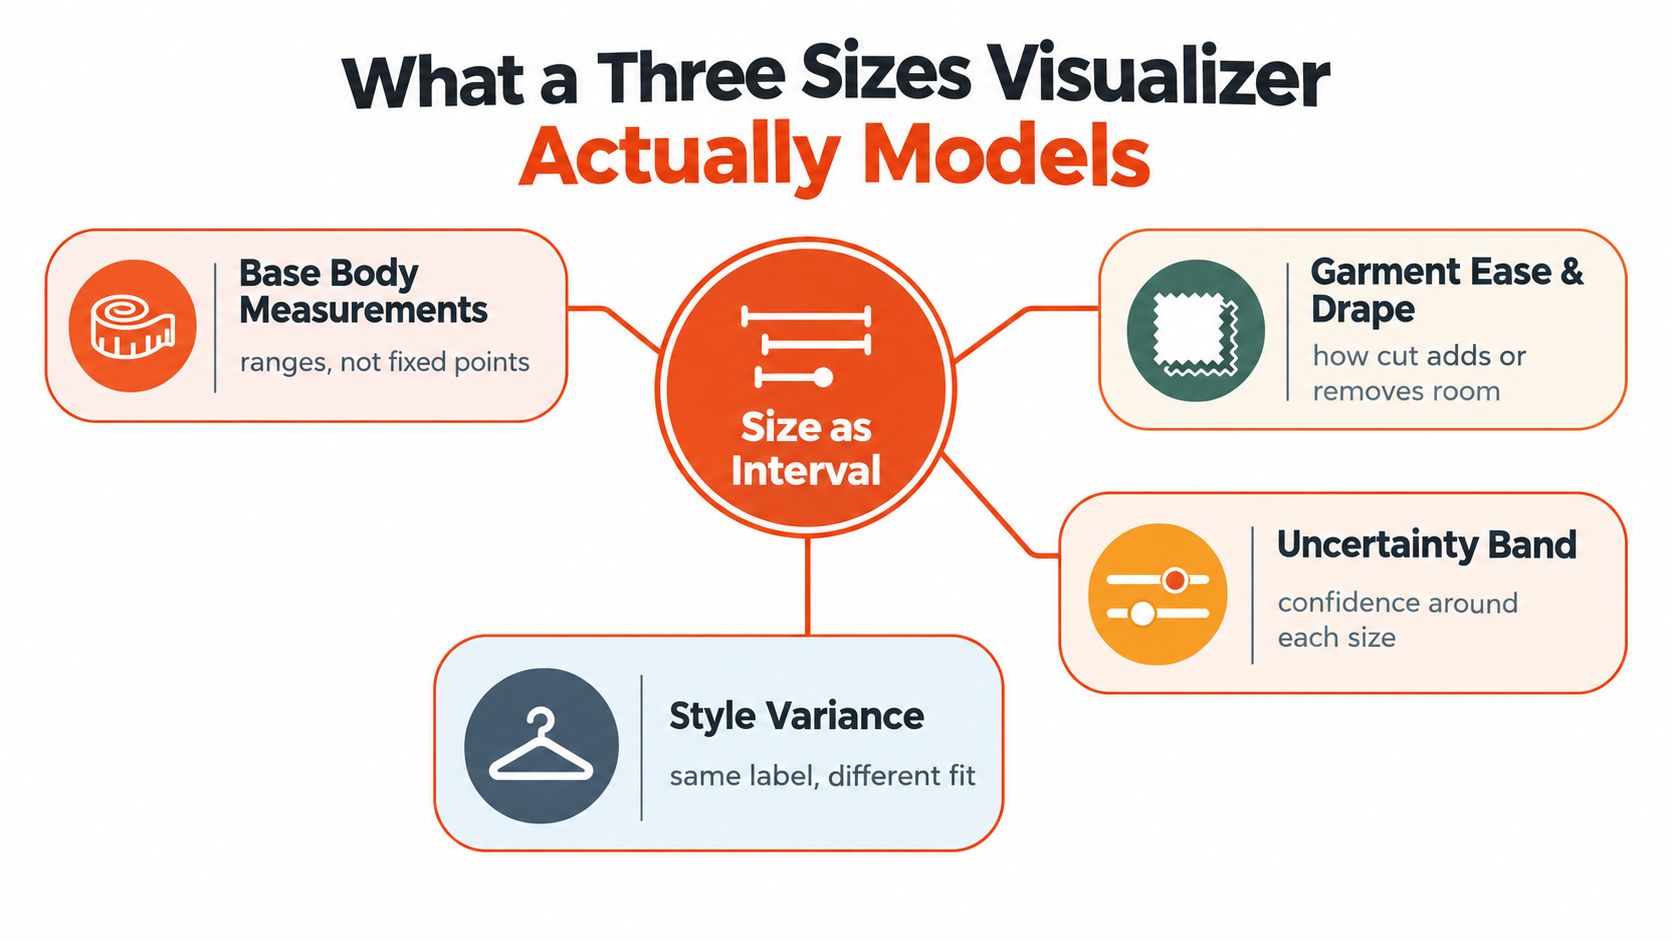
ISO 8559-2 defines clothing sizes through primary body dimensions such as chest, waist, or hip circumference, with optional secondary dimensions. Each size represents minimum and maximum body measurements for which the garment is designed. That framework is more useful than treating “M” as a fixed object because two products with the same label can have different intervals, ease allowances, and grading rules. The ISO publication on size designation and measurement tables supports this interval-based approach.
Start with the right inputs
The engine needs more than a generic conversion table. It should ingest the product's actual size chart, identify whether the chart describes body or finished-garment measurements, and preserve the source and date of the uploaded data. That provenance matters when a brand changes a block, supplier, or grading rule without changing the displayed label.
A practical input sequence includes:
- Normalize shopper measurements. Accept height, weight, age, body shape, and relevant circumference inputs in metric or imperial units. Don't convert without showing the selected unit system.
- Map the product chart. Associate the item with the correct size chart and record whether values describe the body the garment is designed for or the garment after construction.
- Compare three adjacent intervals. Map the shopper's estimated dimensions to the recommended size and its neighboring candidates.
- Expose the constraint. If chest fit is decisive for a shirt but hip fit is decisive for trousers, say so rather than presenting one unexplained label.
- Flag boundary states. A shopper near the edge of an interval should see a clear “between sizes” or lower-confidence state.
A body model adds useful context, but it doesn't replace the data model underneath. Guidance on height, weight, and body modeling is most useful when it connects those inputs to product-level fit logic rather than treating a generated silhouette as proof of fit.
Preserve uncertainty instead of hiding it
The interface should distinguish a confident recommendation from a close call. It should also account for category-specific construction, such as stretch, oversized cuts, tailoring, layering, and asymmetric designs. A label-only system ignores these variables. An interval system can at least make the source of the recommendation inspectable.
Static Charts, Single Models, and Multi-Size Previews
These approaches answer different questions. A retailer shouldn't discard a size chart just because it adds a visualizer, and it shouldn't assume that one polished try-on image provides more evidence than a chart. The useful comparison is the quality of the fit signal each method gives the shopper.
| Approach | Fit Signal | Best For | Main Limitation |
|---|---|---|---|
| Static size chart | Body or garment measurements | Shoppers who know their measurements | Doesn't show drape, clearance, or silhouette |
| Single-model try-on | One visual example of product appearance | Showing styling, color, and general proportions | Can imply false precision for bodies and sizes it doesn't represent |
| Three-size visualizer | Comparative change across adjacent garment sizes | Choosing among plausible sizes before checkout | Only reliable when product data and render variables are controlled |
A static chart is transparent about measurements, but it asks the shopper to perform the translation. The customer must estimate what a given chest range means for sleeve position or how a waist measurement interacts with a tapered cut. Charts also struggle to communicate ease, which is the room designed into the garment beyond the body measurement.
A single model view reduces some of that abstraction, but it creates a different problem. The shopper may treat the displayed body and size as an implied fit guarantee. If the model's proportions, pose, or garment styling don't resemble the shopper's situation, the image becomes a weak proxy.
The multi-size panel is stronger because it shows directional fit signals. Moving from one size to the next can reveal changes in hem placement, sleeve length, shoulder alignment, and body clearance. That comparison is valuable even when the render isn't perfectly photorealistic, provided the system clearly labels the recommendation.
The deciding factor is garment specificity. Showing “Small, Medium, Large” on a generic body model is still label theater if the engine hasn't ingested the product's chart and construction details. A useful panel ties each candidate size to the exact item, then separates observed visual differences from the recommendation logic. That design creates a clear implementation requirement: the front-end comparison is only as credible as the product data and rendering controls behind it.
Designing a Trusted Three-Size Comparison View
Photorealism attracts attention, but controlled comparison earns trust. Virtual try-on research describes two separate technical challenges, warping a garment to the person's body and compositing it while preserving the garment's appearance and identity cues. A fitting interface should evaluate both, but the shopper's immediate need is more specific: what changes when the size changes?
Keep the comparison controlled
All three panels should use the same:
- Body model: Don't alter body proportions between candidate sizes.
- Pose: Keep arm position, stance, and posture fixed.
- Camera: Use identical framing and viewing angle.
- Lighting: Avoid making one size look better because of shadows or exposure.
- Garment identity: Render the same color, material cues, pattern, and product details.
A fit-aware benchmark described in recent virtual try-on research contains 1.13 million try-on triplets, covering 168 body shapes, sizes XS–3XL, and 528 poses. It also includes deliberately extreme mismatches, such as a 3XL garment on an XS body. These details support a controlled three-panel design, because uncontrolled viewpoints make it difficult to tell whether the apparent difference comes from size or synthesis artifacts. The fit-aware virtual try-on benchmark and its technical framing offer a useful reference point.
Show the signals shoppers can judge
The panel shouldn't ask the shopper to admire image quality. It should make the fit differences legible through:
- Garment-to-body clearance, especially around the chest, waist, hips, and upper arms.
- Hem alignment, including whether the garment sits at the expected length.
- Sleeve position, where length and bunching often reveal size mismatch.
- Shoulder placement, a strong signal for structured tops and jackets.
- Silhouette change, particularly for fitted, straight, tapered, and oversized cuts.
Use labels such as “recommended,” “more fitted,” and “more room,” but don't imply that the rendering guarantees physical fit. If the shopper falls near an interval boundary, pair the visual with a confidence cue and a plain-language explanation.
Analytics teams also need separate tests for separate failures. SSIM, LPIPS, and FID can help evaluate image quality, but they don't establish that the recommendation is correct. Hold out body and product measurements, then validate the size decision independently from the render. A beautiful image with the wrong size is still a failed fitting experience.
Business Impact of Better Size Visualization
A shopper opens a product page, hesitates between two sizes, and leaves because the page still asks them to guess. That is the business problem a three-size visualizer should solve. The feature earns value when it reduces uncertainty before checkout and lowers fit mistakes after delivery. Treat it as part of the fit decision system, not as a visual extra.
If you cannot tie the visualizer to a better size choice, nice rendering will not help margins for long. Teams should judge it against the full commercial path: product-page behavior, size selection behavior, completed orders, and what comes back.
Pair leading and lagging indicators
A useful scorecard mixes fast signals with slower operational ones:
- Conversion rate: Compare purchase behavior on eligible product pages where the experience is shown versus withheld, if your test design allows that split.
- Average order value: Measure basket change, but isolate it from promotions, bundles, and merchandising shifts that can move AOV on their own.
- Size recommendation acceptance: Track how often shoppers take the suggested size, and where they override it. Repeated overrides usually point to weak garment rules, not stubborn customers.
- Fit-related returns: Separate sizing returns from damage, shipping issues, and changed preference, or the readout becomes noise.
- Repeat usage: Check whether shoppers come back to the tool across products and categories. Reuse is often one of the clearest signs that the interface is building trust.
These metrics matter together because they reveal trade-offs. A visualizer can lift conversion while increasing returns if it creates confidence without improving fit inference. It can also reduce returns while depressing sales if the recommendation logic is too cautious near interval boundaries. The goal is not more interaction with the panel. The goal is better orders.
Reported lifts also need clean attribution. If a vendor or retailer cites gains, the source should sit with the claim in the same sentence, and the scope should be clear. Without that, percentages create more suspicion than confidence. In practice, teams already working on ecommerce conversion optimization tactics should evaluate the visualizer alongside checkout, pricing, photography, and assortment tests, then isolate what the size experience changed.
Product data still sets the ceiling. Stale size charts, inconsistent garment measurements, and broad category logic will cap performance long before image quality does.
Limits, Privacy, and Honest Positioning
A visualizer becomes less trustworthy when it presents certainty that the underlying data can't support. Smartphone-based systems may estimate 45–60 body measurements with roughly ±1.5–2.0 cm error, and AI size recommenders may reach 80–85% accuracy under defined input conditions, according to a technical review. Those figures don't establish reliable performance for every fabric, pose, body type, or product category. The Interline's reporting on the limits of virtual try-on adoption is a useful warning against treating system-level figures as universal guarantees.
More views can create more confidence than evidence
Three viewpoints may help shoppers inspect drape and proportions, but additional views don't repair weak garment physics or incomplete product imagery. Sleeves, waist placement, pattern alignment, sheer fabrics, stretch, layers, and asymmetric designs can all produce misleading results. A retailer should identify when the tool provides a size recommendation, when it provides only a visual preview, and when the available data isn't sufficient for either.
The interface should communicate the basis of its conclusion. “Matched to the product size chart” is more credible than a vague accuracy badge. Category-specific validation is also essential. A system that performs well for basic T-shirts may need different rules for fitted outerwear, compression garments, or fluid dresses.
Treat privacy as part of the experience
Virtual try-on can require selfies, body measurements, and generated body models, which makes consent unusually important. A review of 69 studies found that personalized scanned avatars can improve body ownership while also creating privacy concerns that reduce adoption intent. Another industry analysis reports that 60–68% of online shoppers express privacy concerns about collecting body measurements, and discusses on-device processing, federated learning, and differential privacy as emerging responses. This analysis of trust in generative AI virtual try-on provides the relevant context.
A responsible flow answers these questions before the shopper uploads anything:
- Is a selfie optional? Offer a generic or selected body model when camera use isn't necessary.
- What gets retained? State retention periods in plain language.
- Is data used for training? Don't leave this buried in a general privacy policy.
- Where is processing performed? Explain the processing location and relevant sharing.
- Can the shopper delete data? Provide a visible deletion route.
More realism can reduce usage if it feels intrusive. Privacy-by-design is therefore a conversion feature, not just a compliance task.
How to Implement a Three Sizes Visualizer on Your Store
Implementation should start with product data, not the interface. A retailer can install a fitting experience quickly, but speed only helps if the uploaded charts describe the products accurately and the recommendation logic can identify the correct chart for each item.
Build the data foundation first
Create a product-to-chart mapping and define the measurement convention for every category. Record whether each value describes the shopper's body or the finished garment. Keep metric and imperial inputs available, and attach a source date to every uploaded chart so merchandising teams can identify stale data.
Then configure the experience around the shopper's real path:
- Collect the minimum useful inputs. Use a short questionnaire for height, weight, age, and body shape, with an optional selfie or model-based alternative.
- Render candidate sizes consistently. Where multi-angle output is available, keep the pose, camera, and lighting aligned across the selected sizes.
- Place the recommendation on the product page. The shopper shouldn't have to leave the item page to remember the result.
- Match the storefront. Use appearance controls so the component feels like part of the store rather than an unrelated widget.
- Set usage governance. Configure session allowances or caps, especially when extra try-ons create variable costs.
For Shopify stores, a one-click app supports rapid deployment and iteration. Other ecommerce platforms can use a JavaScript snippet, which avoids tying the experience to one commerce stack. Retailers comparing tools and integrations can also consult this overview of the best Shopify clothing apps.
Test the flow like a product, not a campaign
Start with mobile because shoppers often complete the journey on a phone, including any camera interaction. Test slow connections, incomplete questionnaires, unit switching, and products with missing or ambiguous chart data. A fallback should explain what the system can and cannot recommend rather than producing a confident label without explanation.
Track fitting-room launches, completed inputs, recommended sizes, overrides, product categories, and fit-related returns. Review the data by garment type because a single catalog-wide score can hide failures in specific cuts or materials. Refresh charts when suppliers, blocks, or grading rules change.
The final governance loop is simple: validate the chart, test the mobile experience, inspect recommendation overrides, compare return reasons, and adjust confidence language by category. A three sizes visualizer works when the retailer treats it as a maintained fit-inference engine, not a one-time marketing layer.
Robosize combines shopper inputs, optional selfie-based or model-based visualization, garment-specific size recommendations, and multi-angle try-on in an on-page fitting-room flow. Visit Robosize to see how the platform can help your store compare adjacent sizes, surface fit confidence, and connect visualization with conversion and return analysis.