The most popular advice about clothing sizes is also the least reliable: “Just convert your usual US, UK, or EU size.” A label can help you find the right row, but it can't tell you whether the garment's bust, waist, hip, chest, shoulder, or inseam dimensions suit your body. A useful size conversion chart for clothes starts with measurements, then translates those measurements into regional labels.
That distinction matters because clothing sizes developed through revised national systems, voluntary standards, brand-specific grading, and regional conventions. The U.S. withdrew its women's clothing size standard in 1983, while international standards such as ISO 8559-2 focus on clothing size designation through body dimensions rather than one universal ready-to-wear code, as explained by the history of clothing sizing and the ISO 8559-2 standard. Use the tables below as starting points, but always verify the product's own measurement chart before ordering.
Table of Contents
- What a Size Conversion Chart Actually Does for Clothes Shopping
- Why Clothing Sizes Differ Across Markets and Brands
- How to Read the Tables in This Guide
- Women's Size Conversion Table Across Major Markets
- Men's Size Conversion Table Across Major Markets
- How Charts Change by Garment Type
- Why Label-Only Conversion Is the Wrong Mental Model
- Brand Variances and Why the Same Size Fits Different
- Measuring Yourself Correctly at Home
- Size Charts as a Return Reduction Tool for Retailers
- Building Product Page Size Charts for Ecommerce
- Common Questions About Size Conversion Charts
What a Size Conversion Chart Actually Does for Clothes Shopping
A size conversion chart for clothes is a measurement framework before it is a label translator. It connects regional labels, body measurements, and garment categories, helping shoppers compare bust, chest, waist, hip, neck, inseam, and sleeve length across markets.
Use it in this order:
- Measure your body. Record the relevant circumference or length in centimeters and inches.
- Identify the garment type. Dresses, jeans, blazers, and footwear require different fit checks.
- Check the measurement basis. Confirm whether the figures describe your body or the finished garment.
- Use the regional label as a lookup key. US, UK, EU, and Japanese labels are shorthand, not proof of fit.
- Read the fit notes. Slim, regular, relaxed, stretch, cropped, and oversized cuts change the selection.
A chart works like a map. The regional label gives you a place name, while the measurements show whether the route reaches your fit requirements. This distinction matters because two products carrying the same nominal size can have different proportions, ease, fabric behavior, or intended silhouettes.
A body chart describes the wearer. A garment chart describes the constructed item, including room built into the design. Confusing the two can lead shoppers to choose a size that matches their body label but not the product's actual dimensions.
For retailers, the chart is a structured bridge between anthropometric data, market labels, product blocks, and shopper decisions. A product-page chart should identify the measurement basis, list the dimensions relevant to that garment, and explain fit terms plainly. That framework gives shoppers evidence they can compare, while helping retailers reduce avoidable returns caused by label-only decisions.
Why Clothing Sizes Differ Across Markets and Brands
A size label is a translation key, not a measurement guarantee. Clothing systems were never built as one permanent global language. In the United States, the U.S. Department of Agriculture measured 15,000 women in a 1939 study to develop a sizing model. Commercial Standard CS 215-58, introduced in 1958, became the first voluntary U.S. women's size standard. The U.S. standard was later withdrawn in 1983, giving brands more freedom to set their own size ladders and grading rules, according to this history of clothing sizing.
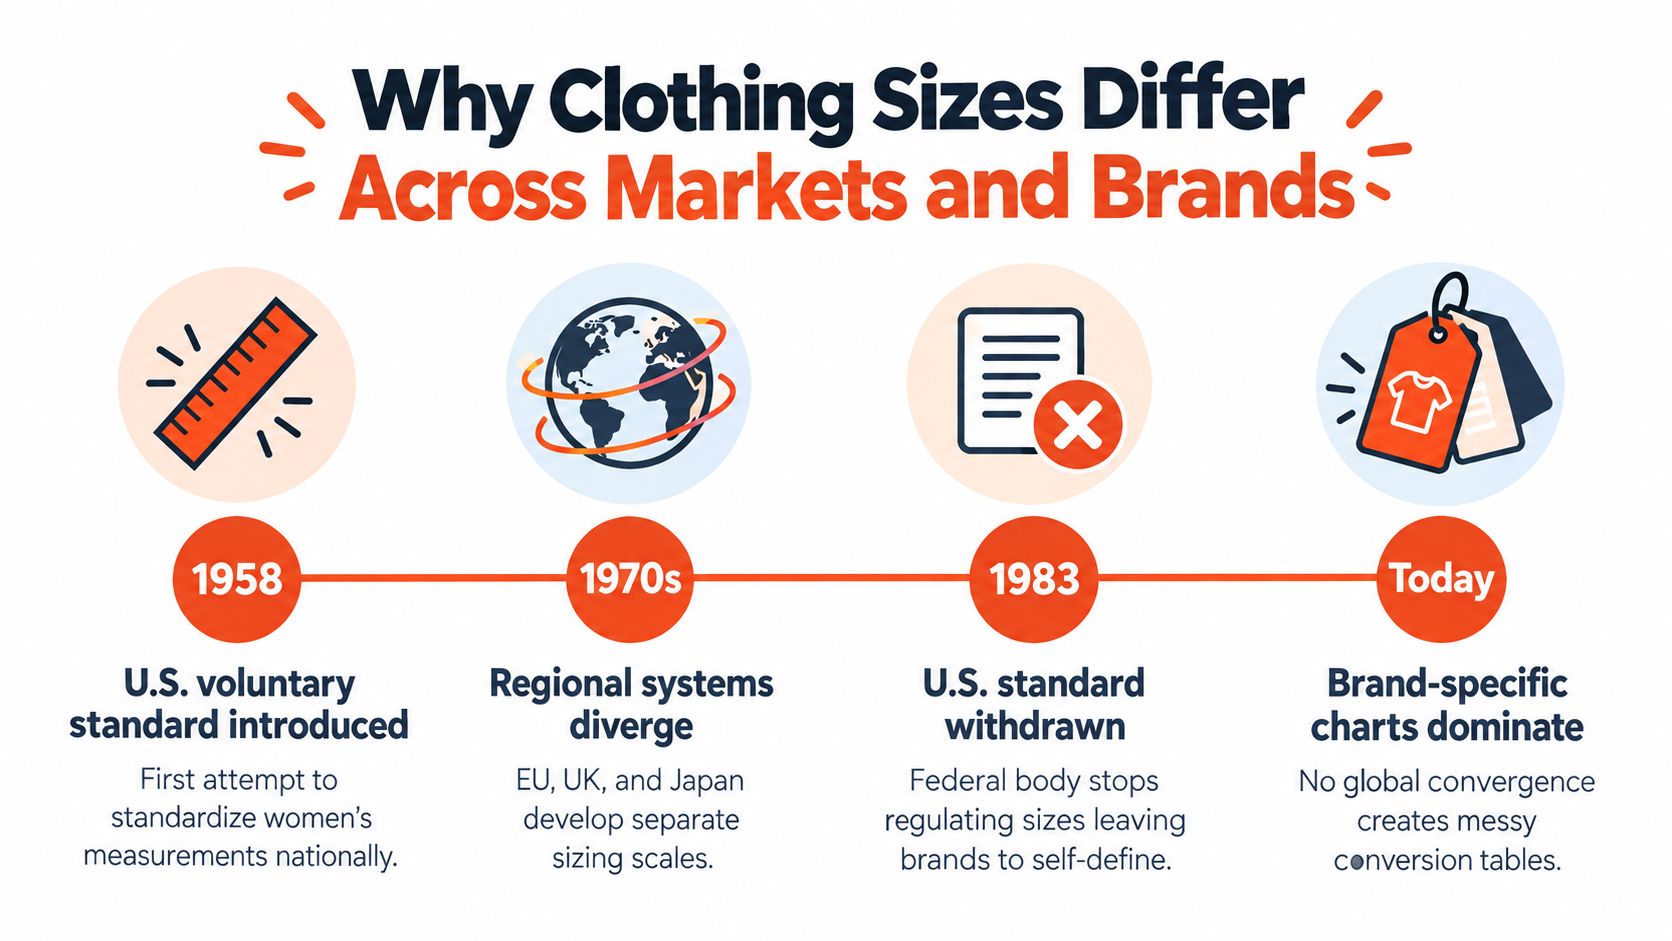
The result is a market where the same number doesn't guarantee the same dimensions. A brand may grade garments around its customer profile, price point, fabric behavior, or intended silhouette. Regional systems developed separately too, so a US, UK, French, Italian, Japanese, or Brazilian label can cover a different measurement range.
International standards provide a shared framework, not a universal label translator. ISO 8559-2:2017 defines primary and secondary garment dimensions and connects them to the body-measurement framework in ISO 8559-1. It gives apparel businesses consistent measurement language, but it does not prescribe one globally enforced set of finished-garment dimensions, as the ISO clothing size designation standard shows.
For shoppers, begin with measurements and use the label as a lookup key. For retailers, product-page charts should state whether figures describe the body or garment, identify relevant dimensions, and explain fit terms. That framework makes regional conversion more useful and reduces returns caused by label-only choices.
How to Read the Tables in This Guide
Start with the column headings, not the size number. Each table should tell you whether its figures describe body measurements or garment measurements. That distinction changes the buying decision because a finished garment generally includes ease for movement, layering, or the desired silhouette.
| Measurement Field | Type | How to Use It | Unit |
|---|---|---|---|
| Bust or chest | Usually body | Measure around the fullest chest or bust point and compare with the brand's stated range | cm or in |
| Natural waist | Usually body | Measure at the narrowest natural point without pulling the tape tight | cm or in |
| Full hip | Usually body | Measure around the fullest hip and seat area | cm or in |
| Garment chest or bust | Finished garment | Compare with your body measurement while allowing for the item's intended ease | cm or in |
| Inseam | Body or garment length | Check whether the figure runs from crotch to ankle or describes the trouser itself | cm or in |
| Neck | Body | Use for dress shirts and collar-based sizing | cm or in |
Use centimeters when the brand publishes metric figures, and inches when that's the retailer's primary format. Don't round a borderline measurement down just to reach a familiar label. If a chart gives both units, compare your unrounded measurement to both columns rather than converting repeatedly.
Letter sizes are convenience tiers, not dependable measurement standards. Chest, bust, waist, hip, neck, and inseam fields are stronger evidence than S, M, L, or XL, because letter labels can shift between categories and brands. If the chart lists only letters, look for a separate brand-specific body table or ask customer service for the underlying dimensions.
Women's Size Conversion Table Across Major Markets
Women's dress conversion is often where shoppers expect a simple answer and encounter the most ambiguity. Independent conversion references show that women's labels across US, UK, EU, Japanese, Italian, French, and Brazilian systems aren't numerically linear, and the underlying measurements can change with the garment category, as illustrated by multi-market clothing size charts.
The table below is a label-navigation example, not a universal manufacturer specification. Because the provided evidence doesn't establish a verified numeric measurement set for every market and size row, measurement cells are intentionally marked for the brand chart rather than filled with invented figures.
| US | US/UK | Italy | France | Japan | Brazil | Bust (cm) | Waist (cm) | Hips (cm) |
|---|---|---|---|---|---|---|---|---|
| 0 | 4 | 36 | 32 | 5 | 34 | Check brand chart | Check brand chart | Check brand chart |
| 2 | 6 | 38 | 34 | 7 | 36 | Check brand chart | Check brand chart | Check brand chart |
| 4 | 8 | 40 | 36 | 9 | 38 | Check brand chart | Check brand chart | Check brand chart |
| 6 | 10 | 42 | 38 | 11 | 40 | Check brand chart | Check brand chart | Check brand chart |
| 8 | 12 | 44 | 40 | 13 | 42 | Check brand chart | Check brand chart | Check brand chart |
| 10 | 14 | 46 | 42 | 15 | 44 | Check brand chart | Check brand chart | Check brand chart |
| 12 | 16 | 48 | 44 | 17 | 46 | Check brand chart | Check brand chart | Check brand chart |
| 14 | 18 | 50 | 46 | 19 | 48 | Check brand chart | Check brand chart | Check brand chart |
The label columns can help you translate a product description, but they shouldn't be the final decision. A shopper buying a fitted dress should compare bust, waist, and hip measurements, then decide which area controls the fit. For a stretch knit, bust may dominate. For a woven dress with a defined waist, the waist and hip can become equally important.
This is also why a size may look different across tops, dresses, and knitwear. Before relying on a conversion row, compare your measurements with the item's own table and review the product's cut. Shoppers who need a more detailed method can also use this guide on calculating dress size from height and weight, while remembering that height and weight alone don't replace bust, waist, and hip measurements.
Men's Size Conversion Table Across Major Markets
Men's clothing charts become confusing when one shopper treats jacket, shirt, trouser, and casualwear labels as if they share one measurement system. They don't. A suit jacket commonly starts with chest circumference, while a dress shirt commonly starts with neck circumference. European labels often express these dimensions in centimeters, whereas familiar U.S. tailoring labels use a different numbering convention.
The table below is a practical navigation framework. It should be paired with the product's own chart because letter labels and regional mappings vary by fit block.
| US | UK | EU | Japan | Chest (cm) | Waist (cm) | Neck (cm) |
|---|---|---|---|---|---|---|
| 36 | 36 | 46 | S | Check brand chart | Check brand chart | Check brand chart |
| 38 | 38 | 48 | M | Check brand chart | Check brand chart | Check brand chart |
| 40 | 40 | 50 | L | Check brand chart | Check brand chart | Check brand chart |
| 42 | 42 | 52 | XL | Check brand chart | Check brand chart | Check brand chart |
| 44 | 44 | 54 | XXL | Check brand chart | Check brand chart | Check brand chart |
| 46 | 46 | 56 | 3XL | Check brand chart | Check brand chart | Check brand chart |
A US 40R jacket and an EU 50 jacket may point to a similar chest category in a conversion table, but that doesn't settle shoulder width, sleeve length, jacket length, or ease. For shirts, the neck measurement may be the controlling field, and a collar label in centimeters shouldn't be read as a jacket size.
Sport and casual lines add another layer of drift. A Japanese M, a European M, and a U.S. M may belong to different blocks, particularly when one item is compression fit and another is relaxed. Trousers and jeans need a separate table built around waist and inseam, so don't use this upper-body chart to choose a bottom.
How Charts Change by Garment Type
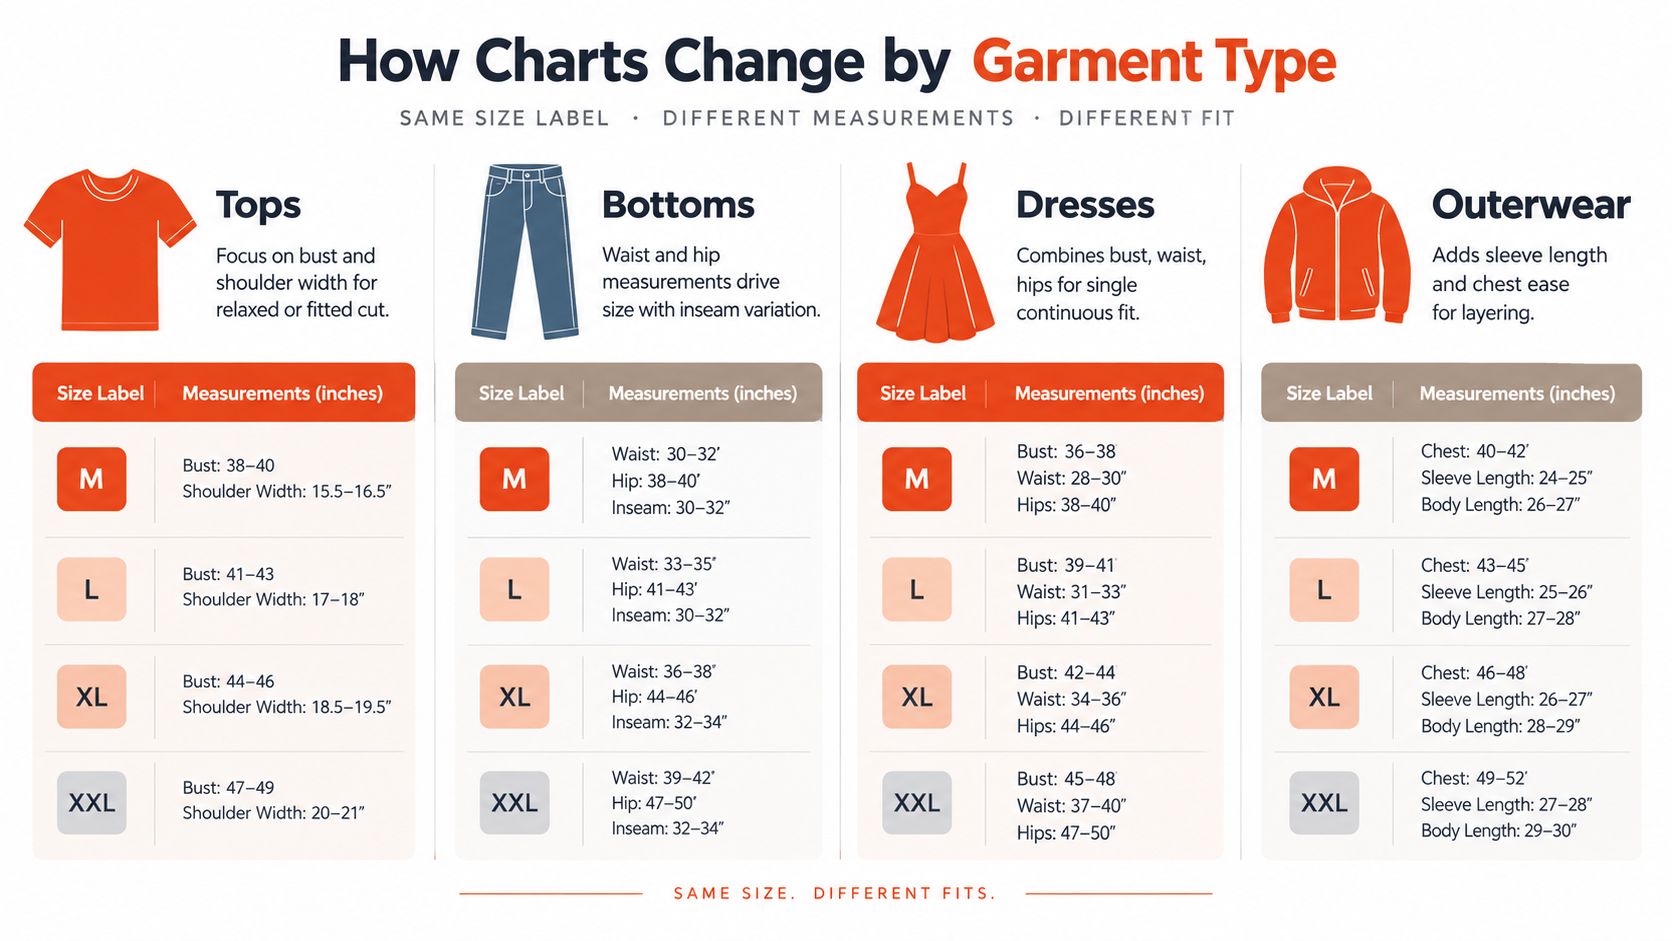
The label stays visible, but the measurement logic changes with the garment. A size M t-shirt, size M coat, and size M pair of leggings may all be correct for the same shopper only if each product uses a different combination of body dimensions and intended ease.
Tops and dresses
Tops usually prioritize bust or chest, with shoulder width becoming important for structured styles. Dresses combine bust, waist, and hip because one garment must follow a continuous body line. A loose shirt may tolerate a bust mismatch that a fitted woven dress won't.
Pants and jeans
Bottoms usually start with waist and hip, then use inseam or garment length to determine where the hem falls. A shopper can match the waist correctly and still need a different length. Denim also responds to rise, stretch, and leg shape, so the waist label doesn't describe the entire fit.
Outerwear and footwear
Coats and jackets need room for layers, plus shoulder, sleeve, chest, and body length checks. A coat chart that copies a t-shirt chart is incomplete because the outer layer must accommodate a different wearing condition.
Footwear uses a separate length-and-width framework. A women's US 8 isn't a smaller men's US 8, because the last, width assumptions, and regional conversion method can differ. Treat apparel and footwear charts as separate systems, even when a retailer displays them on one page.
Why Label-Only Conversion Is the Wrong Mental Model
A label is shorthand for a garment block. It isn't a measurement in itself. Translating US 10 into UK 14 or an EU label into another regional number may help you identify a likely product option, but it leaves the actual fit question unanswered.
Consider two US 10 dresses. Brand A may design a structured woven dress around a narrower waist and limited ease, while Brand B may use a stretch fabric and a fuller hip block. Both labels can be converted into the same regional equivalent, yet the dresses may require different bust, waist, and hip measurements.
| Garment | Label (US) | Label (EU) | Brand A Bust Range | Brand B Bust Range | Aggregate Chart Bust |
|---|---|---|---|---|---|
| Woven dress | 10 | Use brand conversion | Check product chart | Check product chart | Too broad to decide fit |
| Stretch knit dress | 10 | Use brand conversion | Check product chart | Check product chart | Too broad to decide fit |
| Fitted blazer | 10 | Use brand conversion | Check product chart | Check product chart | Too broad to decide fit |
The table's blank measurement fields are deliberate. A generic aggregate chart can't supply brand-specific bust ranges without verified product data. Filling those cells with a single figure would create false precision.
The useful question isn't “What's my EU size?” It's “Which body measurement controls this garment, and what does this brand's block allow?”
A conversion table becomes useful when it exposes that basis. For a fitted item, compare the controlling body measurement first, then inspect the garment measurements and fabric composition. For a relaxed item, the largest measurement may not be the deciding constraint, but the product description should make that clear.
Brand Variances and Why the Same Size Fits Different
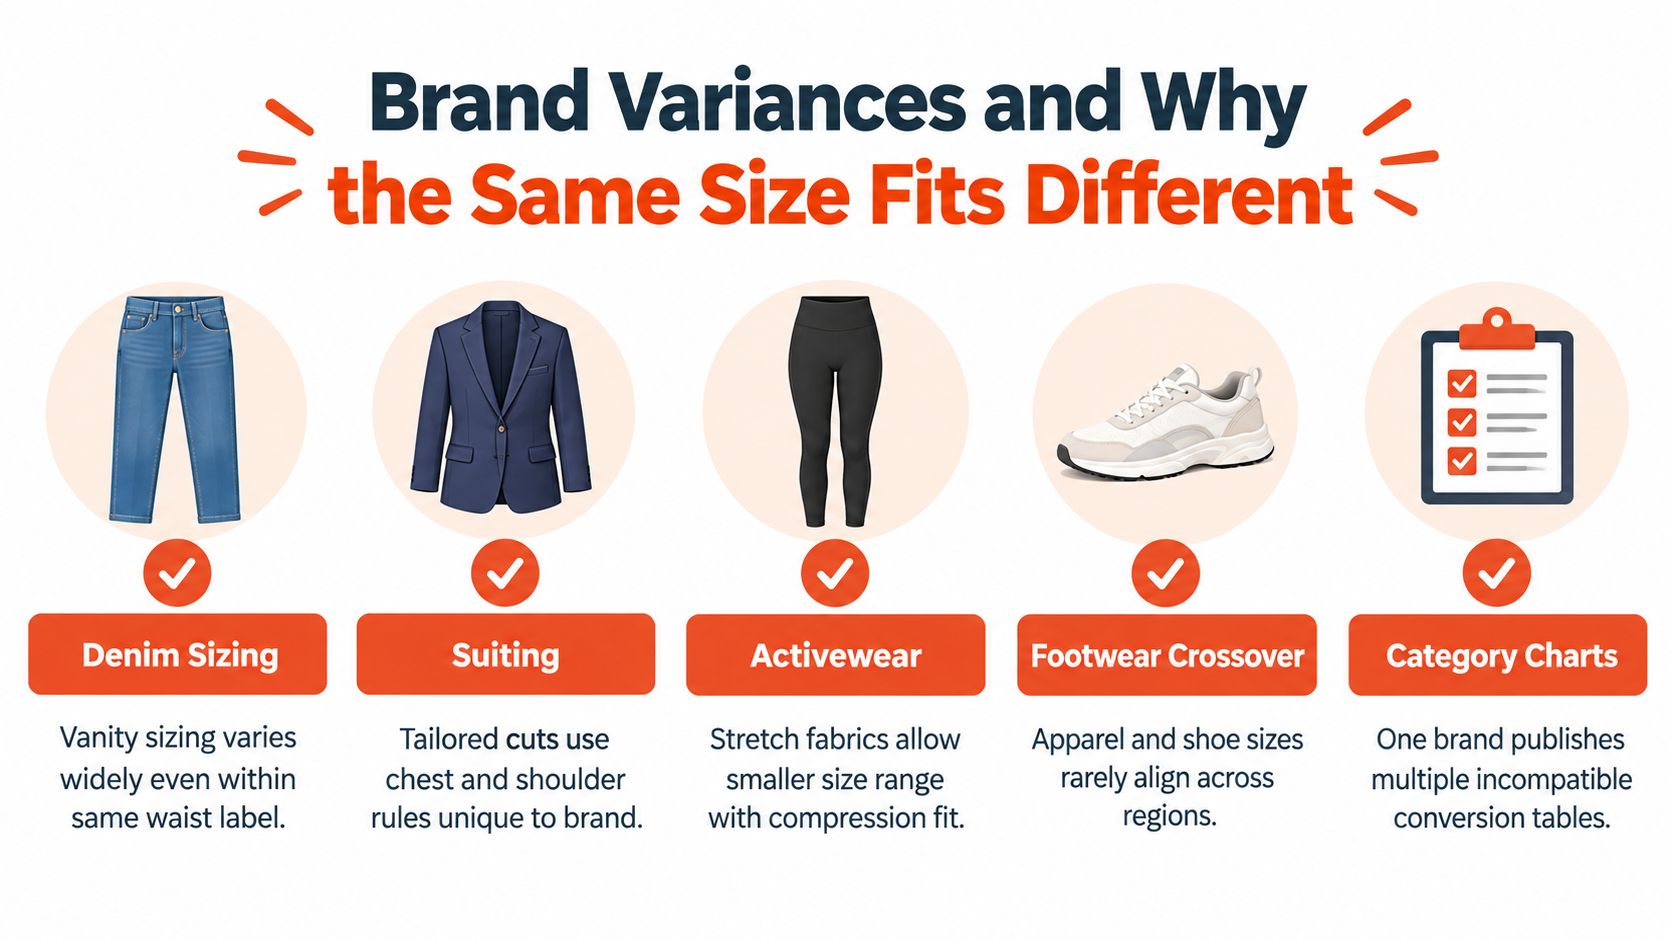
Brands don't all build charts from the same customer profile. Even within one label, denim, suiting, activewear, knitwear, and outerwear can use different grading rules. A brand-specific chart is therefore an artifact of the product line, not a universal reference for every item carrying that brand name.
| Product line | What usually changes the fit decision | Why the label can mislead |
|---|---|---|
| Denim | Waist, rise, hip, inseam, stretch | Waist labels can hide different rises and leg blocks |
| Suiting | Chest, shoulder, sleeve, jacket length | Tailored construction leaves less room for mismatch |
| Activewear | Bust or chest, waist, hip, compression intent | Stretch can make the same letter size feel tighter or looser |
| Footwear | Foot length, width, last, regional system | Apparel and shoe labels don't share a direct fit code |
| Category chart | Product-specific measurement fields | One brand can publish several valid charts |
Check the product page for clues before choosing a size:
- Model and garment notes: Height, displayed size, and fit language can reveal whether the cut is cropped, oversized, slim, or relaxed.
- Fabric behavior: Stretch, recovery, lining, and structure affect how closely body and garment dimensions should match.
- Category context: A brand's M for a compression top may not match its M for a fleece sweatshirt.
- Customer feedback: Reviews that mention specific fit points, such as tight shoulders or a generous hip, are more useful than “true to size.”
- Chart version: Confirm that the table belongs to the exact product category, not merely the brand.
Letter sizes drift because they compress several measurements into one symbol. Numeric labels can drift too. The safest approach is to keep a personal measurement record and compare it with the exact product chart each time you change category, brand, or market.
Measuring Yourself Correctly at Home
A flexible tape measure and light clothing are enough for a useful home measurement record. Stand naturally, keep the tape level, and avoid pulling it tight enough to compress your body. If possible, ask another person to check the tape position for bust, back, and sleeve measurements.
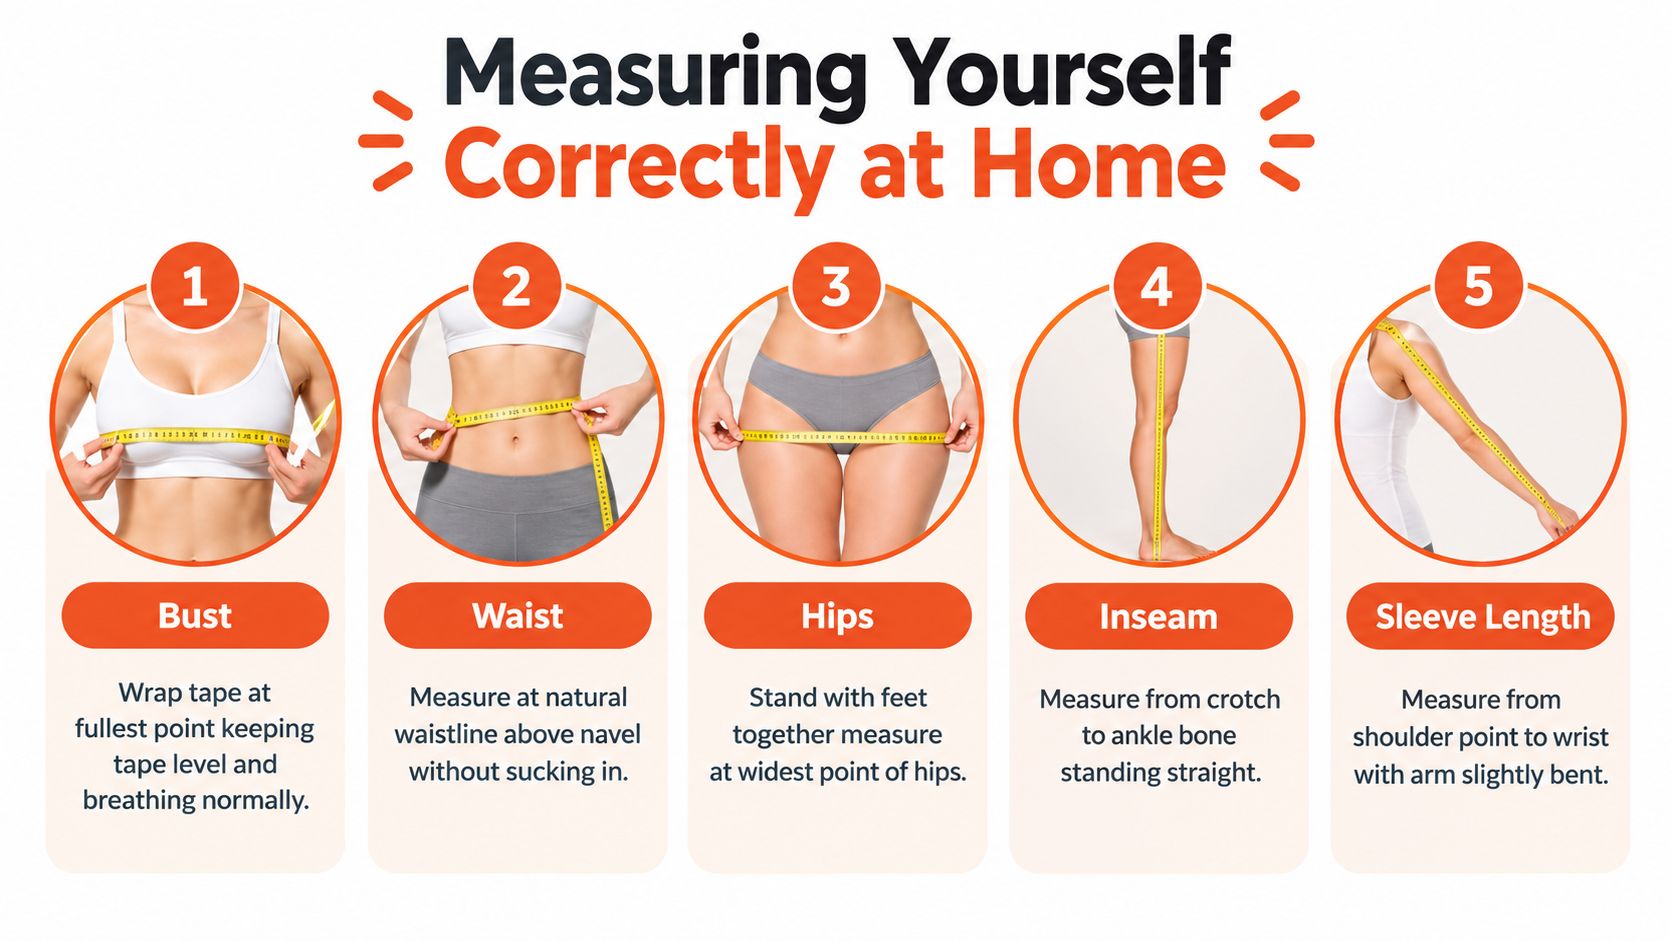
- Bust or chest: Wrap the tape around the fullest point, keeping it horizontal. Breathe normally rather than holding your breath.
- Natural waist: Measure at your natural waistline without sucking in. Don't place the tape where a waistband happens to sit.
- Full hip: Stand with your feet together and measure the fullest point of your hips and seat.
- Inseam: Measure from the crotch to the ankle area while standing straight. A well-fitting pair of trousers can provide a useful cross-check.
- Sleeve length: Measure from the shoulder point to the wrist with the arm slightly bent, especially for fitted garments.
Write each result in centimeters and inches, preserving the original measurement before rounding. If you convert units, use one consistent conversion method and compare the result with the retailer's displayed precision. For a visual demonstration, use this guide to taking your own measurements.
When you land between sizes, inspect the fabric and cut. A relaxed woven garment often gives you more practical room in the larger size, while a stretch or fitted item may work better in the smaller option if the product chart and intended compression support that choice. Don't size up automatically if shoulder or sleeve length would become excessive.
Keep the record somewhere accessible. Update it when your measurements change, and save notes about brands or garment blocks that fit well. That history can be more useful than remembering a label.
Size Charts as a Return Reduction Tool for Retailers
Fit uncertainty is a commercial problem, not just a shopper inconvenience. A review of e-commerce apparel returns found that fit and size issues are among the most common reasons for returns, while online fashion return rates are frequently reported in the range of 20% to 40% or more, depending on the market and product type, according to the review of apparel return behavior.
A retailer absorbs more than the original shipping cost when a shopper chooses the wrong size. Reverse logistics, inspection, restocking, customer service, inventory handling, and potential markdowns can all follow. The practical response isn't adding a larger “size guide” button. The retailer needs to reduce uncertainty at the exact moment the shopper selects a size.
What a useful product chart includes
- Body measurements: Bust, chest, waist, hip, neck, and inseam ranges where relevant.
- Garment measurements: Finished dimensions for structured or fitted products.
- Unit controls: Centimeter and inch views without forcing manual conversion.
- Category logic: Separate tables for dresses, denim, suiting, activewear, and footwear.
- Fit language: Slim, regular, relaxed, oversized, compression, and stretch explanations.
- Boundary guidance: Clear instructions for shoppers whose measurements sit between rows.
Clean measurement data also supports AI body measurement systems and other recommendation tools. Retail teams exploring the wider operational impact can review SelfServe strategies to reduce returns, particularly when sizing information is one part of a broader returns program.
A chart can improve the size-selection experience, but it shouldn't promise certainty that the product data can't support. The retailer's job is to expose the decision variables clearly enough that shoppers can make a better-informed choice before payment.
Building Product Page Size Charts for Ecommerce
Build the chart as structured product data first, then decide how it should appear on the page. A useful schema separates body measurements from garment measurements, stores the market system, supports metric and imperial units, and records fit intent such as slim, regular, relaxed, or compression.
Use product-specific tables rather than one global chart. A dress needs bust, waist, and hip fields. Jeans need waist, hip, rise, and inseam. Outerwear needs chest, shoulder, sleeve, and length. Footwear needs its own length, width, last, and regional logic.
A practical implementation sequence
- Create a measurement model: Define field names, units, measurement positions, and whether each value describes the body or item.
- Attach the correct chart: Match every SKU or product category to its relevant table.
- Add unit switching: Let shoppers move between centimeters and inches without losing their selected size.
- Design for mobile: Use horizontally scrollable tables, stacked measurement cards, or a focused size selector that keeps the key fields visible.
- Make it accessible: Use readable contrast, descriptive labels, logical table headers, and screen-reader-friendly markup.
- Test edge cases: Check borderline measurements, missing fields, long labels, and markets with different size ladders.
On-page chart hygiene also helps recommendation systems because clean inputs are easier to match to a shopper profile. Virtual try-on tools can use the same product and measurement structure, but they still depend on accurate garment data.
For wider product-page design guidance, DesignStack product page advice offers useful context on presenting information without burying the purchase controls. The chart should be easy to open, easy to understand, and close enough to the size selector that shoppers don't lose their place.
Common Questions About Size Conversion Charts
What should I do when my measurements fall between sizes? Check the fabric and silhouette first. A relaxed garment may justify the larger option, while a stretch or close-fitting item may work in the smaller option if the product chart supports it. For pieces, prioritize the measurement that's hardest to alter, often the chest, bust, shoulder, or hip.
Do children's age labels convert reliably? Age labels are rough buying guides, not body measurements. Height-based charts and the brand's actual body dimensions usually provide a stronger comparison, especially when children's proportions vary.
Does virtual try-on replace a size chart? It can add visualization or a personalized recommendation, but it doesn't erase brand variance. The tool still needs accurate product measurements and fit logic, and shoppers should use the chart when the recommendation conflicts with the item's construction.
Can vintage labels be converted directly? Treat them cautiously. An older label may not match the measurements associated with a current label, so measure the garment itself and compare those figures with a similar item you already own.
Robosize helps apparel retailers connect product-specific size charts with shopper inputs, optional selfie-based visualization, and on-page size recommendations. If your store needs a more practical measurement framework for international shoppers, visit Robosize to explore its ecommerce fitting-room and sizing tools.