You pull on a size 8 pair of jeans and expect a familiar fit. The waistband gapes, the thighs feel restrictive, or both. Then you try another size 8 from a different retailer and discover that the same number behaves like an entirely different garment.
That experience isn't a failure of your body or your measuring tape. Clothing labels aren't universal measurements. They reflect a brand's sizing history, target customer, market, garment design, and sometimes its desire to make a smaller number feel reassuring. A vanity sizing chart can reveal part of that story, but it can't predict fit by itself.
Table of Contents
- The Shopper Standing in the Fitting Room with Two Size 8s
- What a Vanity Sizing Chart Actually Shows
- How Labels Drifted From Body Measurements Over Decades
- Why Brands and Markets Inflate Their Labels
- Why the Same Size Means Different Things Across Regions
- Why a Single Chart Cannot Predict Fit on Its Own
- What Retailers Can Do Instead of Posting Another Chart
- The Bottom Line and Questions Shoppers Still Ask
The Shopper Standing in the Fitting Room with Two Size 8s
A shopper steps into a fitting room with two pairs of skinny jeans. The first comes from a premium denim label. It's marked size 8, but the waist gaps when she sits down, and the fabric pulls across the hips. The second pair, from a fast-fashion chain, also says size 8. She works it over her hips, but the waistband won't close.
She checks the sizing chart pinned to the wall. Both pairs appear to assign the same size to nearly identical hip measurements. The number looks reassuringly precise, yet neither garment matches the prediction. One is too generous at the waist. The other is too narrow through the thigh. Her reflection offers no explanation, only two different interpretations of the same label.
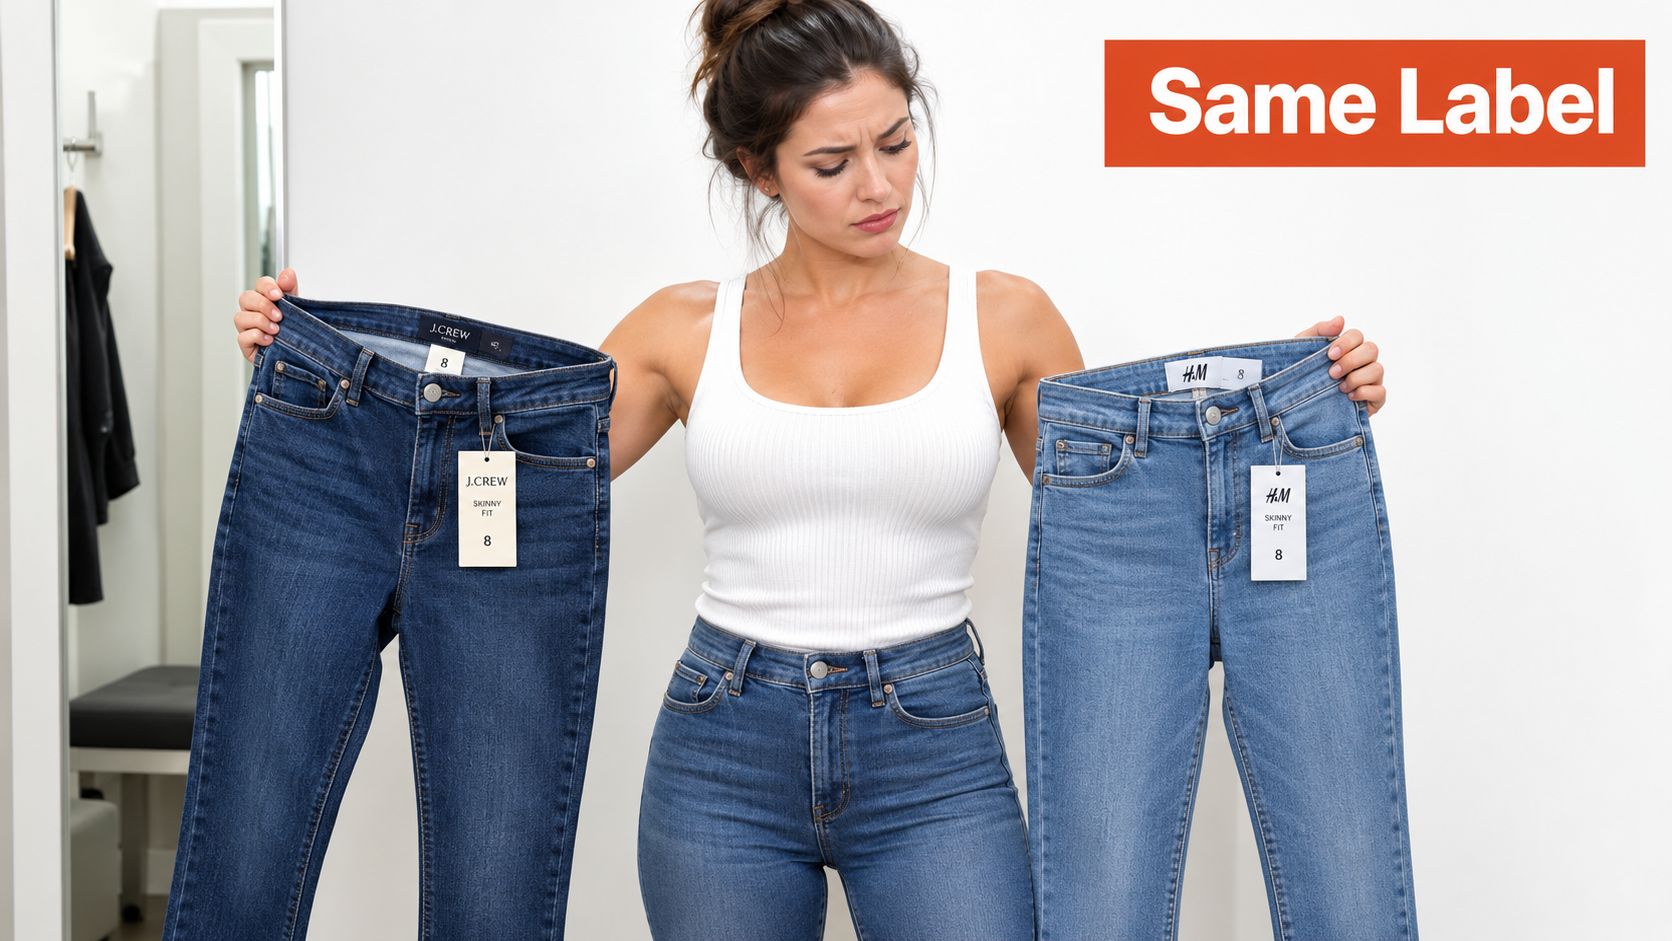
This is the practical meaning of vanity sizing. A brand can attach a smaller nominal size to a garment whose physical measurements are larger than shoppers would historically associate with that number. Another brand can use a stricter label while producing a garment with a similar or smaller finished measurement.
The shopper's problem isn't just that two brands use different size grids. The label hides the variables that determine whether denim fits, including the rise, stretch, waistband construction, thigh shape, and intended silhouette. A rigid high-rise jean and a flexible mid-rise jean can require different choices even when the shopper's body measurements haven't changed.
Practical rule: Treat the number as an identifier, not a measurement.
The chart failed her because it predicted a label, not a fit. That gap is the problem this guide unpacks, from the history of sizing standards to the operational systems retailers can use instead of asking shoppers to solve garment engineering with one static table.
What a Vanity Sizing Chart Actually Shows
Vanity sizing is the practice of assigning a smaller nominal size to clothing than the garment's actual measurements might suggest when compared with older or stricter sizing conventions. A vanity sizing chart is the published grid that connects those labels to body or garment measurements.
A simple analogy helps. Imagine a restaurant whose menu price stays the same while the portion gradually changes. If you look only at the printed price, you miss the change. A side-by-side record of price and portion makes the drift visible. Clothing labels work similarly. The number on the tag is the menu price, while bust, waist, hip, and inseam measurements reveal the physical portion.
A typical chart may include:
- Body measurements: Bust or chest, waist, hips, and sometimes inseam or sleeve length.
- Nominal labels: A number such as 8, a letter such as M, or a regional code.
- Measurement ranges: The body dimensions the brand believes each label should accommodate.
- Garment-specific fields: Some retailers also publish finished garment measurements, rise, or length.
The distinction between body measurements and garment measurements matters. A body chart describes the shopper the garment is intended to fit. A finished measurement chart describes the item itself. Those figures shouldn't be identical because a garment needs room for movement, comfort, and the designer's intended silhouette.
A chart also leaves out important information. It doesn't automatically tell you whether denim is rigid or elastic, whether a blazer is lined, whether trousers sit at the natural waist, or whether a dress is designed to skim the body. It usually doesn't show grading tolerance, which is the small variation introduced during pattern development, cutting, and manufacturing.
That makes a vanity sizing chart useful for narrowing the field, but weak as a final decision tool. The most reliable interpretation combines the label with actual garment dimensions, fit notes, fabric behavior, and the intended silhouette.
How Labels Drifted From Body Measurements Over Decades
The United States once had a more formal reference point for women's sizing. The official women's size standard published as Commercial Standard CS 215-58 in 1958 was later revised in 1970. By 1983, even the voluntary federal standards had been withdrawn, leaving most apparel companies to establish their own labels and grading practices. The history of vanity sizing documents this policy shift and its effect on the relationship between labels and measurements.
That change didn't create every inconsistency overnight. It removed a shared reference while brands continued to adjust labels for their own customers, price positions, and product categories. A widely cited historical comparison shows the scale of the drift: a women's size 14 in 1937 corresponded to a size 8 in 1967 and a size 0 in 2011. Those labels describe a sequence of changing conventions, not a stable body measurement.
The same pattern appears in measurement data. A history of vanity sizing and size charts reports that, across the 50 years between 1958 and 2008, a US size 8 expanded by up to 6 inches in body measurements. The label stayed familiar while the dimensions attached to it moved.
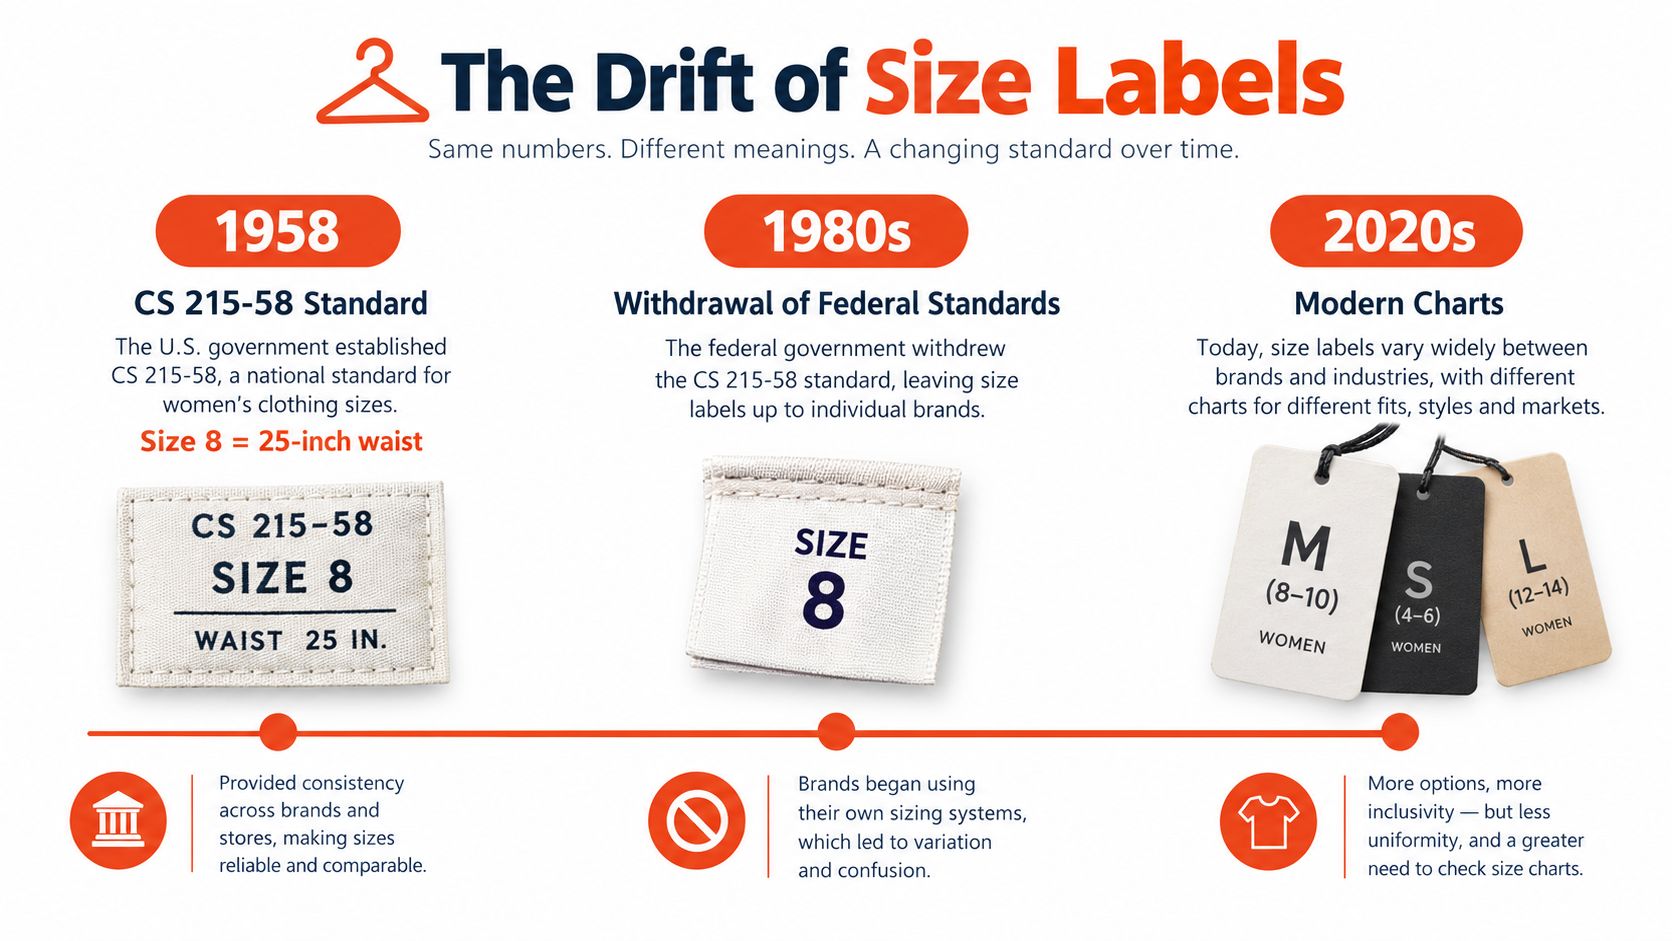
The label is a moving target
A useful historical timeline looks like this:
- 1958: Commercial Standard CS 215-58 provides a formal US reference for women's sizes.
- 1970: The standard is revised.
- 1983: Voluntary federal standards are withdrawn.
- After withdrawal: Apparel companies increasingly control their own label and grading decisions.
- Modern retail: Shoppers encounter brand-specific, category-specific, and market-specific charts.
The resulting problem is cumulative. One brand adjusts a label to make its customer feel better. Another changes its grade rules to suit a younger customer or a different price tier. A third localizes its range for another country. Over time, the number on the tag becomes less useful as a universal reference.
A modern retailer therefore shouldn't treat historical size numbers as fixed facts. The operational question is simpler: What are the garment's actual measurements, and how does this particular design behave on a body?
Why Brands and Markets Inflate Their Labels
Labels carry emotional meaning. A smaller number can make a shopper feel that a garment is more flattering, even when the physical dimensions differ little from a larger historical size. A brand may also want its labels to match the expectations of a target customer, especially when competing retailers use different conventions.
This doesn't mean every brand changes labels for the same reason or that every smaller label represents the same amount of inflation. A 54-retailer US sample found that moderately priced brands tended to use more inflated labels, while very expensive designer brands measured significantly smaller. The study also found that brands aimed at younger adult women ran smaller than those targeting older women. That retailer study on vanity sizing shows how price positioning and customer positioning can influence the label itself.
The commercial logic behind the number
A merchandising team may make several decisions before a label reaches a waistband:
- Brand identity: A label can support a brand's desired emotional positioning.
- Customer expectations: Shoppers compare a new item with the sizes they already buy from similar retailers.
- Price tier: Different market segments can use different measurement conventions.
- Product category: Suiting, denim, knitwear, and occasionwear often apply different ease and construction rules.
- Market localization: Brands modify ranges and labels for regional shopping habits.
The result isn't a single industry-wide inflation rate. It's a collection of house rules. A size 8 from one brand may have more room because the brand targets relaxed everyday dressing. Another size 8 may be narrower because the designer expects a close, structured fit.
A table can expose the pattern, but not solve it
A practical comparison would show the actual waist measurement, the historical reference used for comparison, and the difference in physical dimensions. The supplied evidence doesn't provide a complete retailer-by-retailer dataset with labeled waists, inflation values, and average markups, so those fields shouldn't be filled with invented numbers.
| Price tier | Labeled waist | Inflation vs. 1958 standard | Average markup |
|---|---|---|---|
| Moderately priced brands | Brand-specific | More inflated labels documented in the retailer sample | Not provided |
| Very expensive designer brands | Brand-specific | Significantly smaller measurements documented in the retailer sample | Not provided |
| Other brands | Varies | Depends on label and grading rules | Not provided |
The regulatory gap matters because retailers aren't required to use one universal sizing grid. Once the federal voluntary standards were withdrawn, each apparel house gained more freedom to define labels, proportions, and grading. Consumers are left with a market where the same number can describe different bodies, different garments, and different commercial intentions.
Why the Same Size Means Different Things Across Regions
A label doesn't travel cleanly across borders. The US, UK, EU, Japan, Italy, and Brazil developed distinct sizing ecosystems, with different numeric or letter codes and different relationships between body measurements and garment labels. Regional conversion tables can help a shopper begin, but they aren't reliable fit guarantees.
That limitation matters for international ecommerce. A shopper may recognize a familiar number on a product page and assume it has the same meaning in another market. In practice, brands localize their size runs, use regional conventions, and sometimes apply their own internal grading on top of those conventions.
The common request for one universal vanity sizing chart is therefore misleading. A universal chart would need to reconcile brand rules, market labels, garment measurements, and product construction. A conversion table can translate a code. It can't translate the cut of a trouser or the stretch of a jersey dress.
Why conversion tables remain approximate
Sizing systems reflect different histories and commercial practices. Some markets use numeric labels, others use letter codes, and several use both. Even when two labels appear equivalent, the underlying body dimensions may not match, and brands can place the same garment in different positions within a local size run.
The comparison below is deliberately qualitative because the verified evidence doesn't provide a complete, source-backed set of waist measurements for every listed market.
| Market | Nominal label | System type | Approx. waist |
|---|---|---|---|
| US | Numeric label | US numeric sizing | Brand-specific |
| UK | Numeric label | UK numeric sizing | Brand-specific |
| EU | Numeric label | European numeric sizing | Brand-specific |
| Japan | Numeric label | Japanese numeric sizing | Brand-specific |
| Italy | Numeric label | Italian numeric sizing | Brand-specific |
| Brazil | Letter or numeric label | Brazilian market sizing | Brand-specific |
The same nominal size can map differently across the US, UK, EU, Japan, Italy, and Brazil, as regional sizing guidance describes in this overview of cross-border size confusion. That means a retailer selling internationally should localize more than the currency and spelling. It should localize the measurement logic, label presentation, and recommendation experience.
For shoppers, the safest approach is to find the product's own measurements and check which market the chart serves. For retailers, the answer is a region-aware recommendation system that keeps the shopper's body profile separate from the local label. The output can then say, in effect, “this garment is likely to fit you in this market,” rather than pretending that one code has universal meaning.
Why a Single Chart Cannot Predict Fit on Its Own
A static table assumes that measurements are enough. They aren't. A chart can tell you the waist circumference of a garment or the body range associated with a label, but it can't fully describe how fabric responds when a person sits, walks, reaches, or prefers a close versus relaxed fit.
Consider two pairs of women's trousers. One is rigid denim with a structured high rise and a cigarette leg. The other is a stretch jegging containing 2% elastane. Even if both list the same waist measurement, the first may require more ease at the waist and thigh, while the second can conform more closely to the body. The fabric composition and pattern shape change the decision.
A high-rise cigarette trouser also behaves differently from a low-rise boyfriend silhouette. A lined wool blazer may hold its shape and need room across the shoulders, while an unstructured linen jacket may drape away from the body. The chart describes measurements in isolation. Fit happens when a specific garment interacts with a specific body and a specific preference.
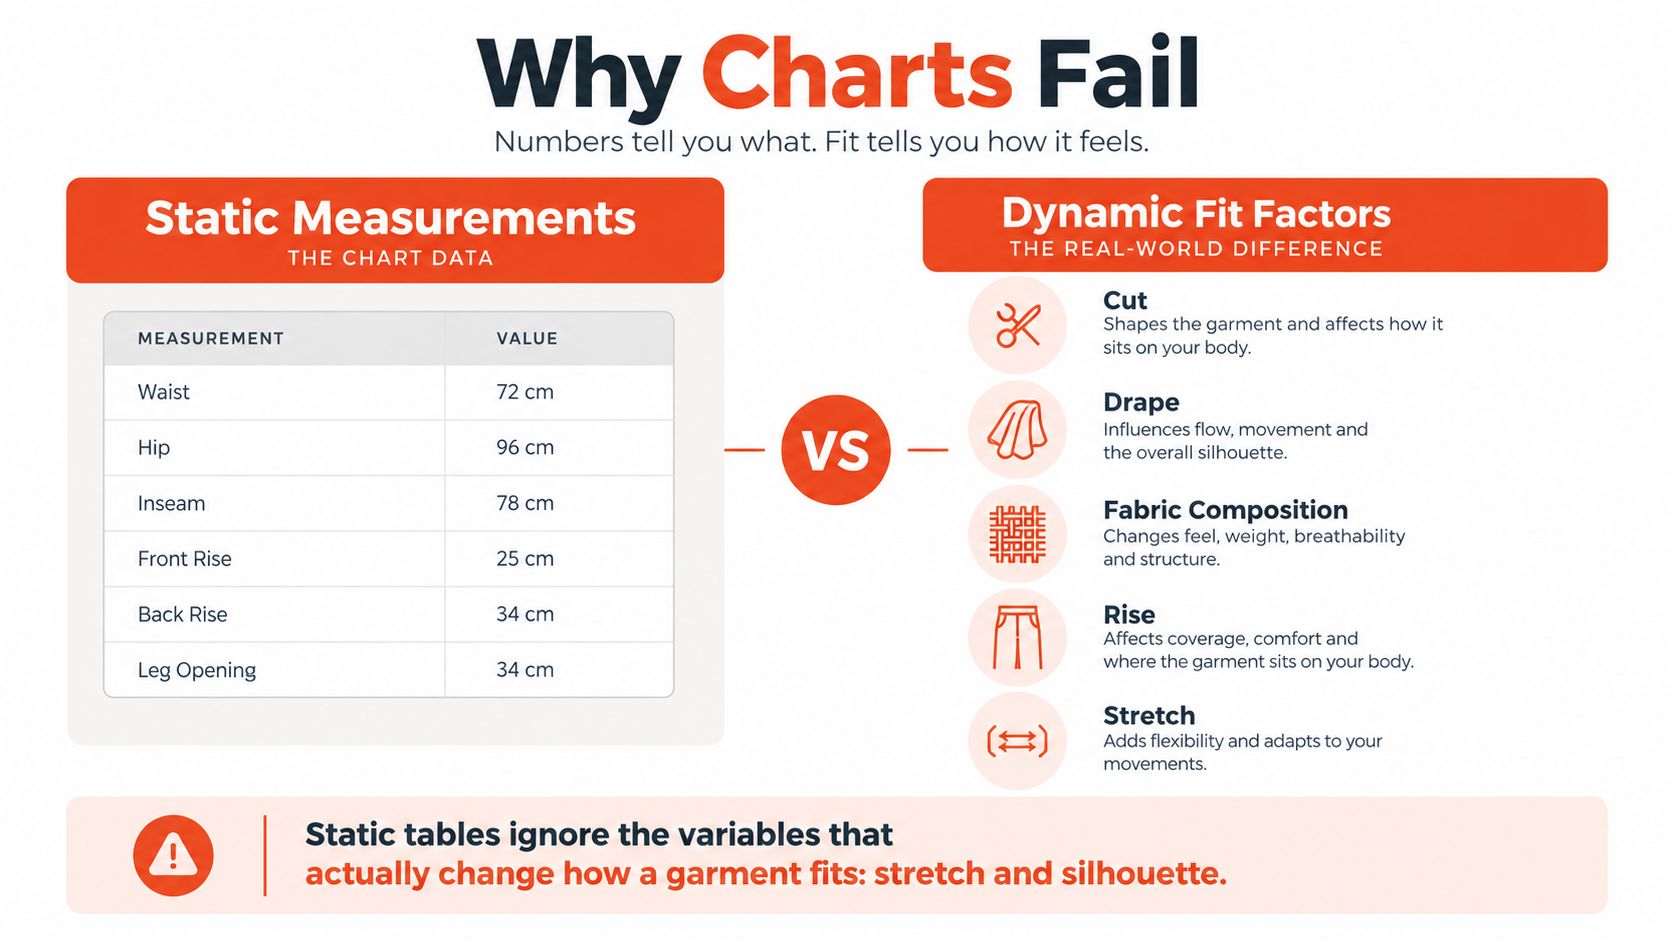
What the table leaves out
A shopper may need to account for:
- Cut: Slim, straight, relaxed, oversized, or shaped through a particular area.
- Drape: Whether the fabric falls away from the body or follows its contours.
- Stretch: The amount of give and how quickly the fabric recovers.
- Rise and proportions: Where trousers sit and how the garment distributes length.
- Construction: Lining, seams, darts, shoulder structure, closures, and waistband design.
- Fit preference: Whether the shopper wants close contact, room to move, or an intentionally loose silhouette.
Two people with identical bust, waist, and hip measurements can still choose different sizes in the same dress. One may prefer a skim fit, while the other wants movement at the waist. One may have a longer torso or fuller upper body, variables a three-number lookup doesn't capture.
For a useful overview of the limits of traditional tables, see this clothing size calculator guide. The practical next step is to collect richer inputs through a short questionnaire, then use optional visual information to refine proportions and body shape. A per-garment model can adjust the recommendation for stretch, cut, and intended silhouette instead of applying one chart to every product.
What Retailers Can Do Instead of Posting Another Chart
Retailers shouldn't remove size charts. They should stop treating charts as the complete fit experience. The strongest product page combines the familiar body-size grid with information about the garment itself and a recommendation method that accounts for the shopper and the product together.
Start with the product data. For trousers, publish waist, hip, inseam, rise, and leg opening where relevant. For tops and jackets, add chest, shoulder, sleeve, and body length. For dresses, include bust, waist, hip, length, and the intended fit through each area. These details turn a label into something a shopper can evaluate.
Build the product page around fit evidence
A practical merchandising checklist includes:
- Add garment measurements: Show finished dimensions alongside body measurements, and identify which measurement matters most for the silhouette.
- Write direct fit notes: “Runs slim through the thigh” is more useful than “true to size.” Mention whether the fabric has stretch and whether the item is intended to skim or drape.
- Use model references: State the model's height, displayed size, and relevant measurements when permission and data quality allow. Shoppers can use the reference as a visual anchor, not as a promise that their body will match.
- Show construction details: Explain the rise, lining, closure, waistband, and fabric behavior. A rigid denim cut needs different guidance from a stretch knit.
- Separate regional labels: Present the local market label while keeping the underlying measurement data consistent.
- Capture feedback: Record size exchanges, return reasons, fit comments, and garment-level patterns. Merchandising teams can use that feedback to revise notes and product specifications.
Merchandising principle: Publish enough information for a shopper to understand both the body and the garment. Neither one is sufficient alone.
Add recommendation technology at the point of choice
A modern recommender can ask for height, weight, age band, body shape, and fit preference. An optional selfie or front-facing photo can refine the body-shape signal for shoppers who choose to provide it. The system then applies per-garment logic for stretch, cut, proportions, and the brand's own chart.
Robosize, for example, creates a shopper-specific body model from a short questionnaire and optional selfie, renders products on that model, and displays a garment-specific size recommendation on the product page. It supports a one-click Shopify installation and a JavaScript snippet for other ecommerce platforms, while its mobile body scan approach shows how phone-based input can reduce manual measuring.
Virtual try-on should complement, not replace, product data. A shopper needs to see the garment's silhouette and read why a recommendation was made. Retailers can also support the visual experience with guidance on creating fashion videos with Veo3, especially when demonstrating movement, drape, and fit from more than one angle.
The operating model is a feedback loop: collect inputs, recommend per garment, observe purchases and returns, then improve the product rules. That approach treats sizing as a live merchandising system rather than a PDF that gets uploaded once and forgotten.
The Bottom Line and Questions Shoppers Still Ask
A vanity sizing chart is a snapshot of how a brand wants its labels to function. That doesn't make it useless, but it explains why the number alone fails. The reliable signal is the combination of body measurements, finished garment measurements, fit notes, fabric behavior, and product-specific recommendation logic.
Shoppers should measure at home with a soft tape, standing naturally and keeping the tape level. Record bust or chest, natural waist, hips, and any product-specific measurement such as inseam. Compare those figures with the retailer's chart, then read the fit notes before choosing a size.
Retailers should publish the underlying data and add technology that respects variation. A questionnaire, optional selfie, and per-garment model can make the online decision more personal than a static label lookup.
Questions shoppers still ask
How should I measure myself accurately?
Wear close-fitting clothing or undergarments, stand naturally, and don't pull the tape tight or hold your breath. Measure the fullest part of the bust or hips and the natural waist, then check the tape placement in a mirror or ask someone to help.
Does vanity sizing affect menswear or childrenswear?
The verified evidence here focuses on women's apparel. The broader lesson still applies: any market can use brand-specific labels, so shoppers shouldn't assume a nominal size is a universal measurement.
Will the US reintroduce a federal sizing standard?
The supplied evidence documents the withdrawal of voluntary federal standards in 1983, but it doesn't establish a current plan to restore one. Retailers and shoppers should therefore work with the brand and product data available now.
How do returns policies fit into the problem?
Returns can give shoppers a safety net, but they don't fix inconsistent labels. Retailers should use return reasons and size exchanges as product-level fit feedback, then improve measurements, notes, and recommendations before the next purchase.
Robosize helps apparel retailers move beyond a static vanity sizing chart with questionnaire-based recommendations, optional selfie visualization, and per-garment fit guidance on the product page. Visit Robosize to explore how a virtual fitting room can connect your catalog's measurement data with a more useful online sizing experience.